-
-
1,2,3 Sign (of Sarcoidosis)
-
Air Bronchogram
-
Air crescent sign
-
Atelectasis
-
Atoll Sign (Reversed Halo)
- Batwing Appearance
-
Bronchovascular Involvement
-
Bulging fissure sign
-
Cavitation
-
Cephalisation
-
Cervicothoracic sign
-
Comet tail sign
-
Consolidation
-
Continuous diaphragm sign
-
Crazy paving sign
-
CT halo sign
-
Deep sulcus sign
-
Double density sign
-
Doughnut sign
-
Finger-in-glove sign
-
Fleischner sign
-
Galaxy Sign in Sarcoidosis
-
Garland Triad, Pawnbrokers Sign and 1,2,3 Sign
-
Geometric Distortion
-
Golden S sign aka S Sign of Golden
-
Ground Glass
-
Halo Sign
-
Hampton hump
-
Head Cheese Sign
-
Hilum overlay sign
-
Honeycomb
-
Interstitial Edema
-
Interstitial Fibrosis
-
Juxtaphrenic peak sign
-
Kerley Lines
-
Kerley A lines
-
Kerley B lines
-
Kerley C lines
-
-
Luftsichel sign
-
Lymph Node Rim Sign
-
Lymphovascular Involvement
-
Mach Effect
-
Mass
-
Mediastinal Shift
-
Mosaic perfusion
-
Nodule
-
Solid
-
Ground Glass
-
Mixed
-
Miliary Nodules
-
Micronodules
-
-
Pawnbrokers Sign Garland Triad, Sign an1,2,3 Sign
-
Reversed Halo (Atoll)
-
Reticulations
-
Rim Sign
-
Scimitar sign
-
Shaggy Heart Body
-
Signet ring sign
-
Silhouette sign
-
Split pleura sign
-
Tree-in-bud sign
-
Westermark sign
-
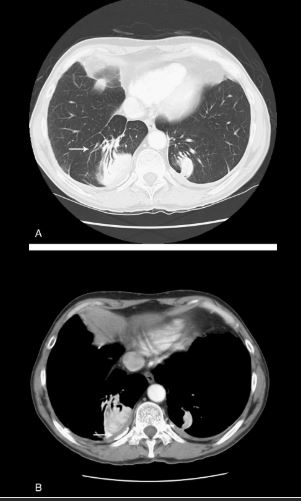
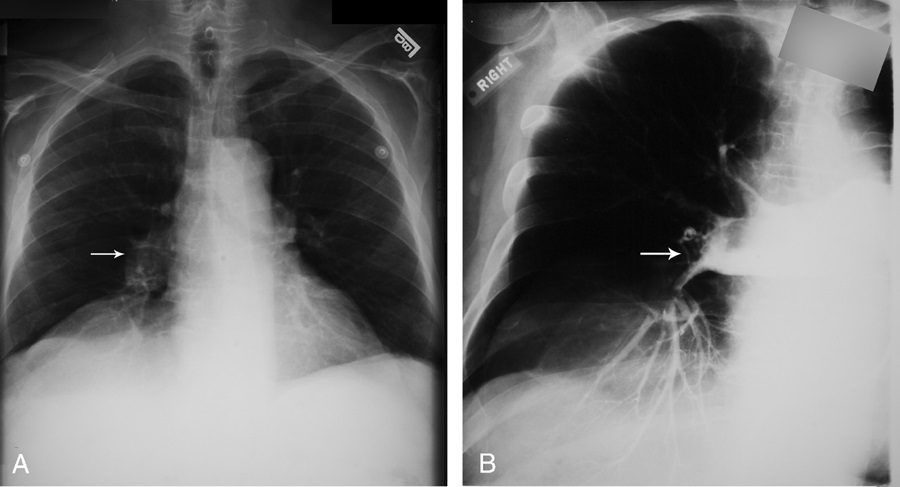
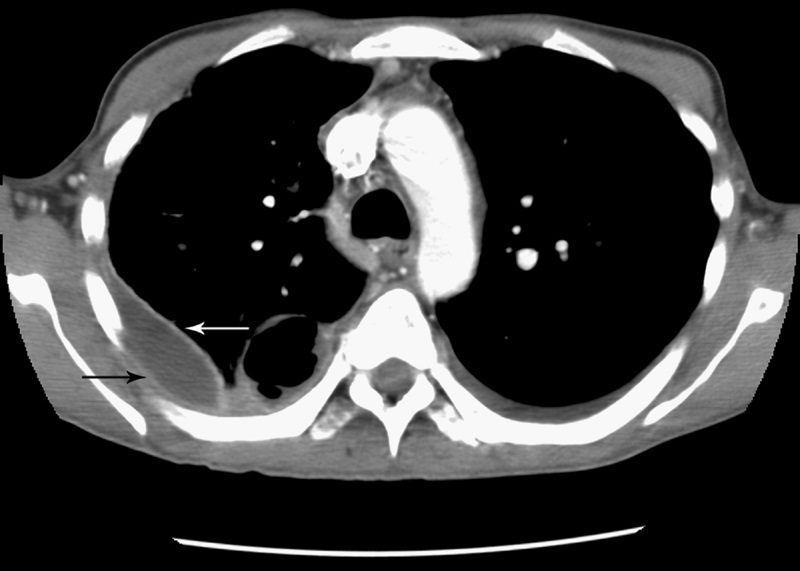
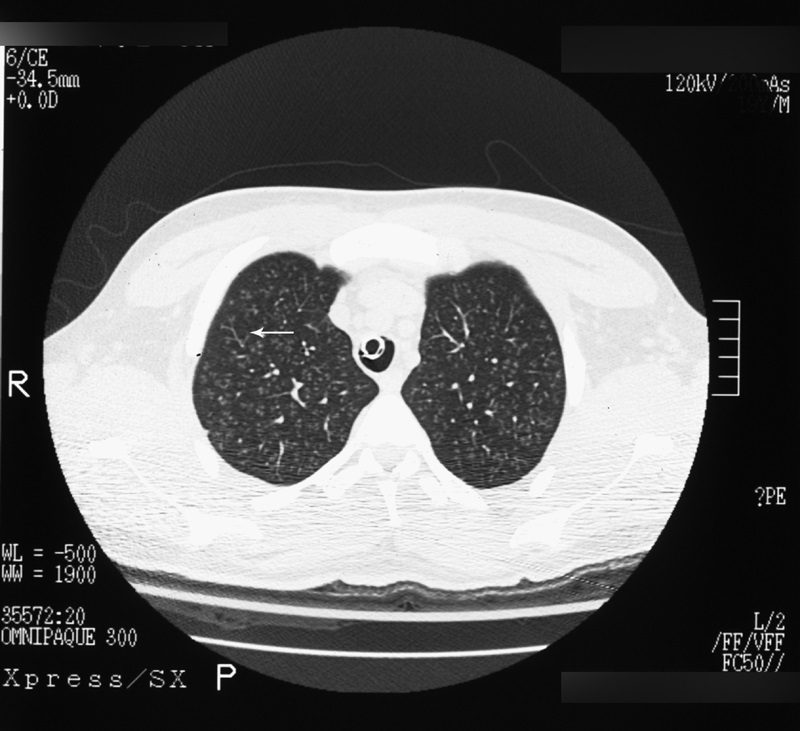
Air crescent sign

Source
Signs in Thoracic Imaging
Journal of Thoracic Imaging21(1):76-90, March 2006
The air crescent sign appears as a variably sized, peripheral crescentic collection of air surrounding a necrotic central focus of infection on thoracic radiographs (Fig. 1A) and CT (Fig. 1B).2–4 It is often seen in neutropenic patients who have undergone bone marrow or organ transplantation and is most characteristic of infection with invasive pulmonary aspergillosis. The fungus invades the pulmonary vasculature, causing hemorrhage, thrombosis, and infarction. With time, the peripheral necrotic tissue is reabsorbed by leukocytes and air fills the space left peripherally between the devitalized central necrotic tissue and normal lung parenchyma.5 Thus, the presence of the air-crescent sign heralds recovery of granulocytic function.4 Other causes of the air crescent include cavitating neoplasms, bacterial lung abscesses, and infections such as tuberculosis or nocardiosis.6
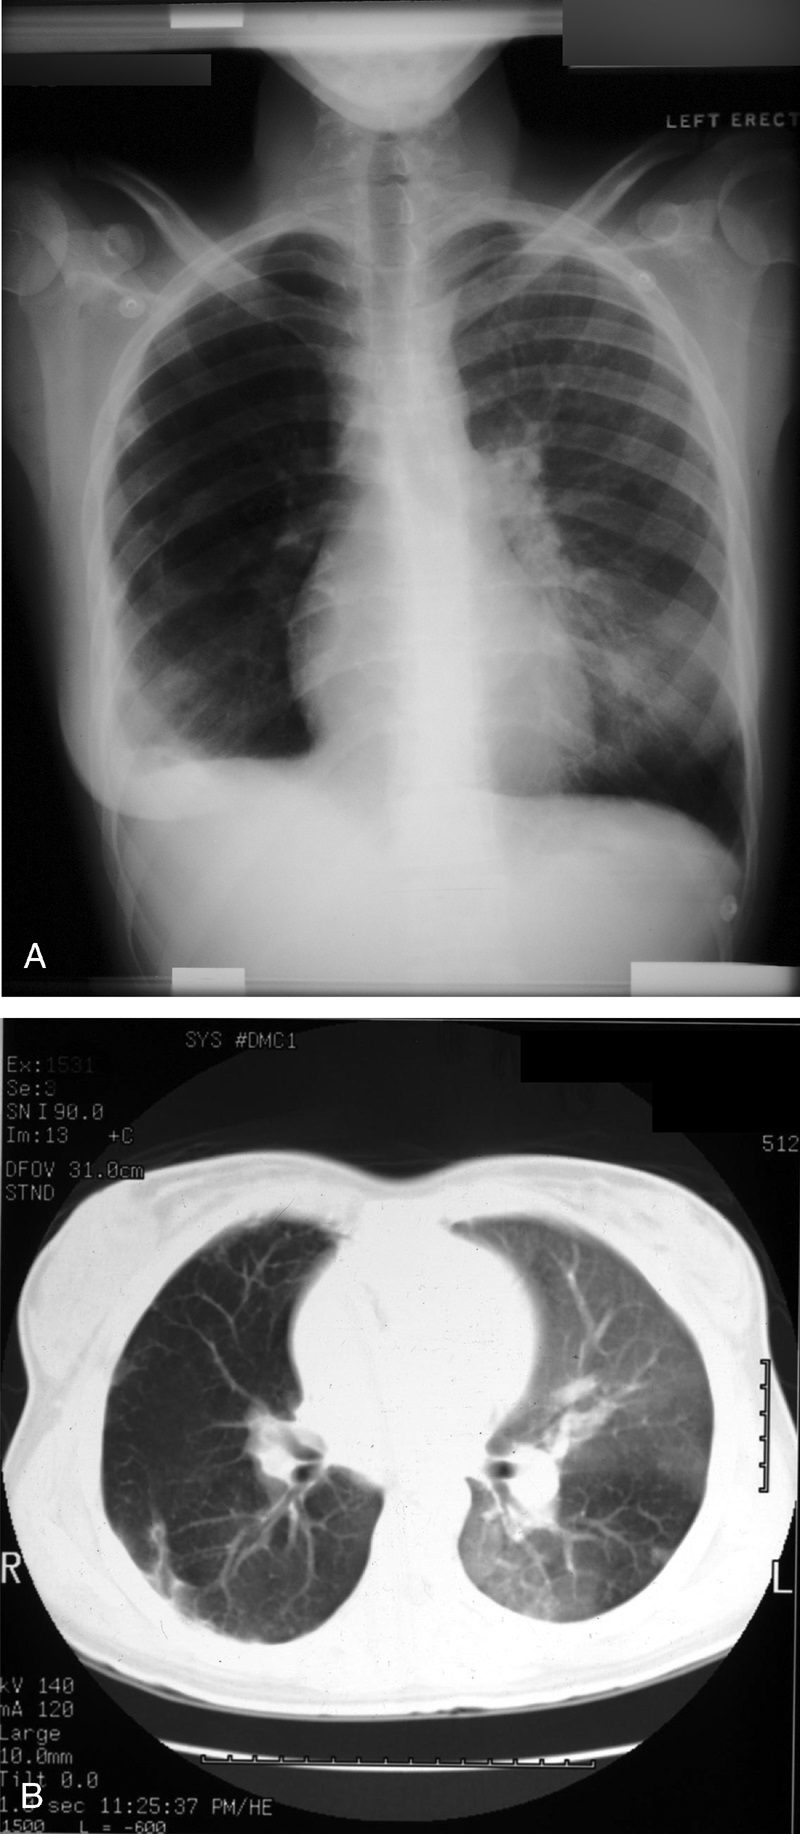
Bulging fissure sign
Source
Signs in Thoracic Imaging
Journal of Thoracic Imaging21(1):76-90, March 2006.
Classically, this sign is associated with consolidation of the right upper lobe (Fig. 2) due to Klebsiella pneumoniae infection.7 Due to the tendency for Klebsiella to produce large volumes of inflammatory exudate, the involved lobe expands and exerts mass effect on the adjacent interlobar fissure.8 The normally straight minor fissure on the lateral view bulges convex posteroinferiorly due to rapid lobar expansion.3,7 Although previously reported in up to 30% of patients with Klebsiella pneumonia,8,9 the finding is identified less commonly today, most likely due to rapid prophylactic implementation of antibiotics.3 Other less common causes of the bulging fissure sign include Hemophilus influenzae, tuberculosis, pneumococcal pneumonia, large lung abscesses, and lung neoplasms.10
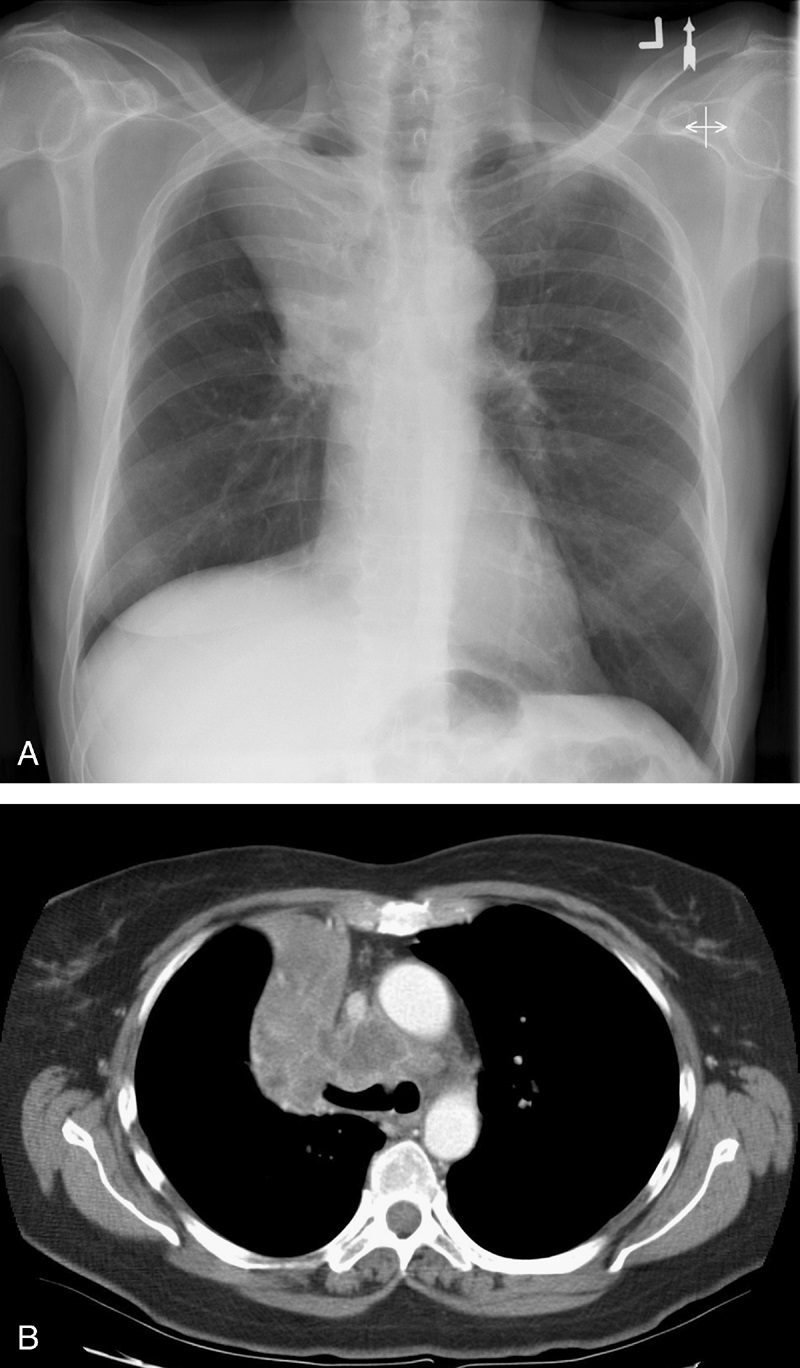
Cervicothoracic sign
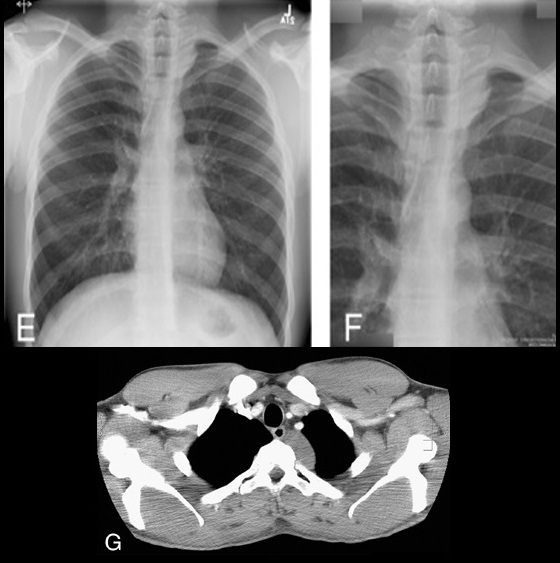
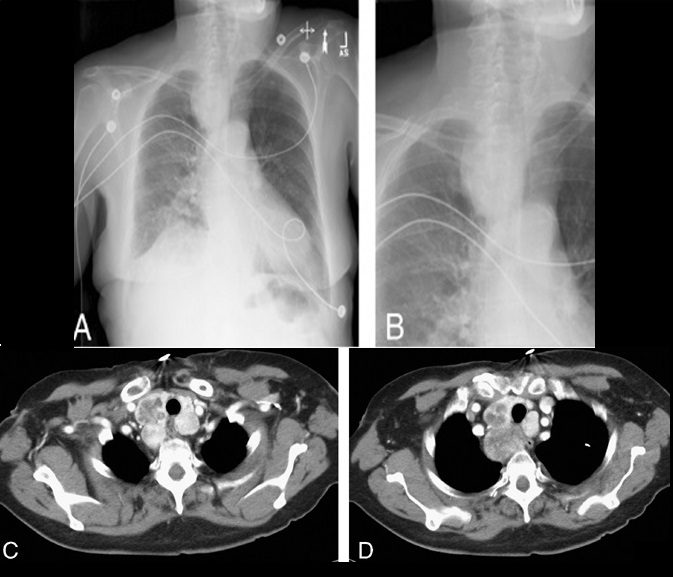
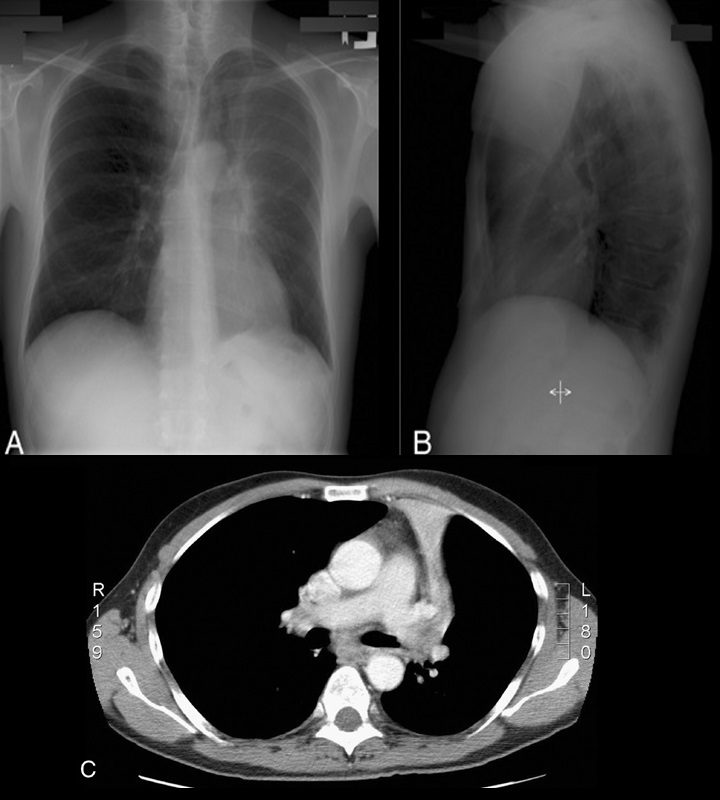
Cervicothoracic sign. Frontal radiograph of the chest with a coned view (A, B) demonstrates a mass projecting over the right superior mediastinum with indistinct borders along its superior margin. Follow-up enhanced CT of the chest (C, D) reveals a mass extending from the cervical region into the anterior mediastinum representing a multinodular goiter. Conversely, in the case of a posterior mediastinal mass, the supralateral margins project above the level of the clavicles and are clearly defined on the frontal radiograph (E, F) in this patient (different patient from A, B) with a biopsy-proven ganglioneuroma (G, CT image).
Source
Signs in Thoracic Imaging
Journal of Thoracic Imaging 21(1):76-90, March 2006.
This sign is based on the understanding that if a thoracic mass is in direct contiguity with the soft tissues of the neck, the borders delineating their point of contact will be lost or obscured.11 Anatomically, the thoracic inlet parallels the first ribs, and the posterior aspects of the lung apices extend further superiorly than the anterior portions.12 On PA chest radiographs, a mass clearly delineated on all borders above the level of the clavicles lies posterior to the level of the trachea and completely within the lung.13 When the cephalic border of a mass is obscured at or below the level of the clavicles, it is deemed to be a “cervicothoracic lesion”13 involving the anterior mediastinum (Figs. 3A–E). Mediastinal masses posterior to the trachea are well outlined above the level of the clavicles due to the interface with lung in the posterior aspects of the lung apices (Figs. 3F, G).
Cervicothoracic sign
Cervicothoracic sign. Frontal radiograph of the chest with a coned view (A, B) demonstrates a mass projecting over the right superior mediastinum with indistinct borders along its superior margin. Follow-up enhanced CT of the chest (C, D) reveals a mass extending from the cervical region into the anterior mediastinum representing a multinodular goiter. Conversely, in the case of a posterior mediastinal mass, the supralateral margins project above the level of the clavicles and are clearly defined on the frontal radiograph (E, F) in this patient (different patient from A, B) with a biopsy-proven ganglioneuroma (G, CT image).
Source
Signs in Thoracic Imaging
Journal of Thoracic Imaging 21(1):76-90, March 2006.
This sign is based on the understanding that if a thoracic mass is in direct contiguity with the soft tissues of the neck, the borders delineating their point of contact will be lost or obscured.11 Anatomically, the thoracic inlet parallels the first ribs, and the posterior aspects of the lung apices extend further superiorly than the anterior portions.12 On PA chest radiographs, a mass clearly delineated on all borders above the level of the clavicles lies posterior to the level of the trachea and completely within the lung.13 When the cephalic border of a mass is obscured at or below the level of the clavicles, it is deemed to be a “cervicothoracic lesion”13 involving the anterior mediastinum (Figs. 3A–E). Mediastinal masses posterior to the trachea are well outlined above the level of the clavicles due to the interface with lung in the posterior aspects of the lung apices (Figs. 3F, G).
Comet tail sign
Source
Signs in Thoracic Imaging
Journal of Thoracic Imaging 21(1):76-90, March 2006.
Identified as a curvilinear opacity arising from a rounded, subpleural opacity on CT (Fig. 4A, arrow), the “comet tail” denotes the distorted curving of pulmonary vessels and bronchi toward a region of round atelectasis.14–17 The atelectatic lung typically abuts an area of pleural effusion or thickening, and there are associated signs of volume loss. Round atelectasis is an unusual form of atelectasis most commonly associated with asbestos-related pleural disease (Fig. 4B, arrow), but also seen with other chronic forms of pleural disease, such as tuberculosis, histoplasmosis, pulmonary infarcts, or congestive heart failure.14–17 It is also known as atelectatic pseudotumor, folded lung, or Blesovsky syndrome, after the physician who initially postulated an association with asbestos exposure.18 Most often found in the posterior aspect of the lower lobes, it may demonstrate significant contrast enhancement and contain air bronchograms.14–17 Histopathology demonstrates fibrous thickening of the visceral pleura with extensive pleural folding and invagination.19 The exact cause is still debated. One theory suggests that a pleural effusion is the inciting event causing passive atelectasis and pleural invagination.20 Fibrous adhesions will eventually develop between the visceral and parietal pleural surfaces, so that when the effusion clears, the entrapped lung folds in on itself. An alternate theory suggests that a focal inflammatory pleural fibrotic response secondary to irritants such as asbestos, is solely responsible for causing invagination of the pleura and regional atelectasis of the subjacent lung.14,19,21
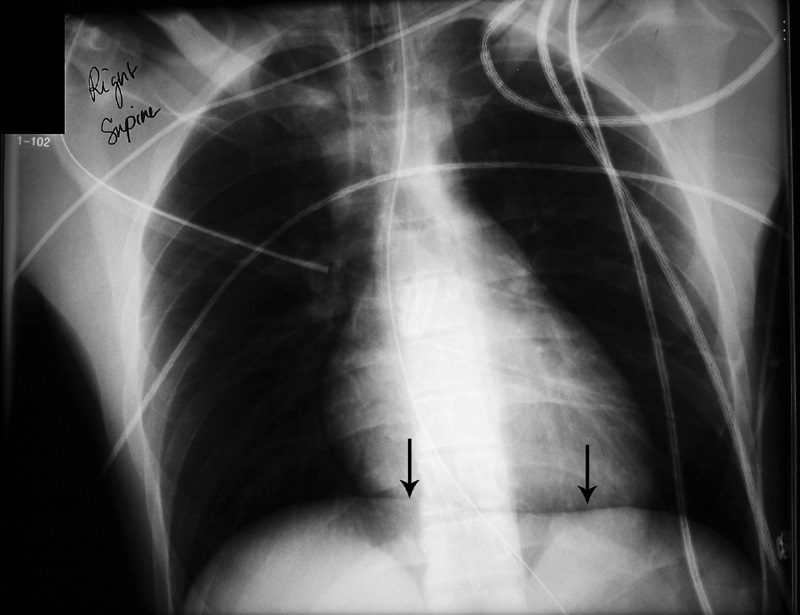
Continuous diaphragm sign
Source
Signs in Thoracic Imaging
Journal of Thoracic Imaging 21(1):76-90, March 2006.
Identifiable on PA chest radiography (Fig. 5, arrows), there is a continuous line of lucency extending across the midline, above the diaphragm.22,23 This is representative of air tracking posterior to the heart in pneumomediastinum and is helpful in differentiating from a pneumothorax.4,22,23
Crazy paving sign
Source
Signs in Thoracic Imaging
Journal of Thoracic Imaging 21(1):76-90, March 2006.
The “crazy paving” pattern12 is described at HRCT of the lungs (Fig. 6). The pattern is caused by thickening of interlobular septa superimposed on areas of ground glass opacification.24–26 It was first used to describe the pattern of pulmonary alveolar proteinosis, but can be seen in a variety of diseases. Histopathologically, the ground glass attenuation in alveolar proteinosis correlates to lipid-rich, intra-alveolar proteinaceous fluid, with thickening of the interlobular septa due to adjacent inflammatory reaction.13 Infectious causes include Pneumocystis carinii pneumonia, organizing pneumonia, usual interstitial pneumonia, non-specific interstitial pneumonia, and exogenous lipoid pneumonia. Other entities, such as respiratory bronchiolitis with interstitial lung disease,27 sarcoidosis, adult respiratory distress syndrome, pulmonary hemorrhage, and mucinous BAC, also less commonly demonstrate the crazy paving pattern.12–15
CT halo sign
Source
Signs in Thoracic Imaging
Journal of Thoracic Imaging 21(1):76-90, March 2006.
The CT halo sign appears as a zone of ground-glass attenuation around a nodule or mass (Fig. 7) on computed tomographic (CT) images.2–4,6,28 In febrile neutropenic patients, the sign suggests angioinvasive fungal infection, which is associated with a high mortality rate in the immunocompromised host.2–4 The zone of attenuation represents alveolar hemorrhage,2,4,6,28 whereas the nodules represent areas of infarction and necrosis caused by thrombosis of small to medium sized vessels.2–4,6,28,29 Other infectious causes include candidiasis, cytomegalovirus, herpes simplex virus, and coccidioidomycosis.30 The CT halo sign may also be caused by non-infectious causes, such as Wegener granulomatosis, metastatic angiosarcoma, Kaposi sarcoma, and brochioloalveolar carcinoma (BAC).29,30 Due to the lepidic growth pattern of BAC, where the tumor cells spread along the alveolar walls, the typical ground glass halo visualized with the sign results.29
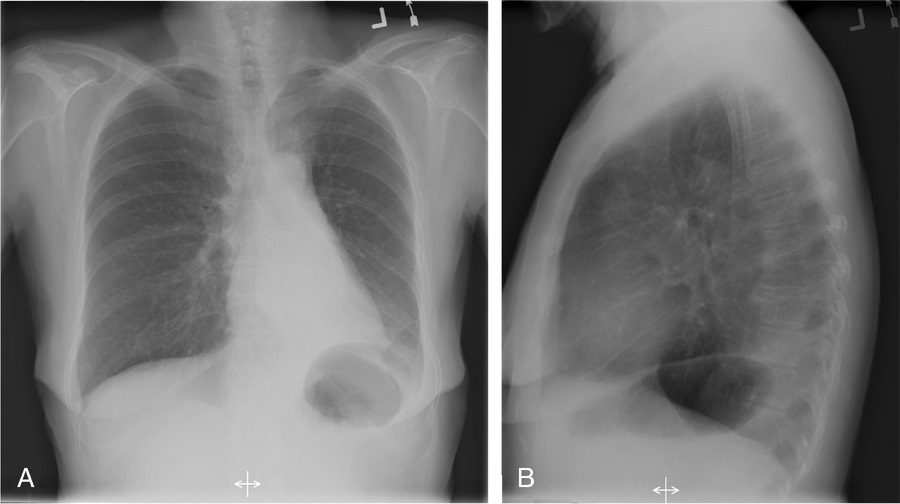
Deep sulcus sign
Source
Signs in Thoracic Imaging
Journal of Thoracic Imaging 21(1):76-90, March 2006.
The presence of radiolucency in a deep costophrenic sulcus on a supine thoracic radiograph (Fig. 8) is characteristic of a pneumothorax in a supine patient.31 Intrapleural air rises to the highest portion of the hemithorax leading to the presence of a lucency in the anteromedial, subpulmonic, and lateral basilar space adjacent to the diaphragm.3,4,31 It is useful in confirming suspected pneumothorax on AP supine radiography in compromised patients, such as those in the intensive care setting.4
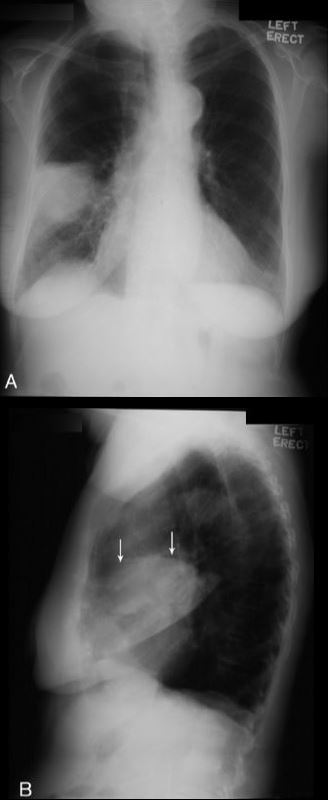
Double density sign
Source
Signs in Thoracic Imaging
Journal of Thoracic Imaging Double density sign. Frontal radiograph (A) in a patient with known mitral stenosis shows a retrocardiac curvilinear density paralleling the right heart border, confirmed on the lateral view (B) to be due to left atrial enlargement.
Source
Signs in Thoracic Imaging
Journal of Thoracic Imaging 21(1):76-90, March 2006.21(1):76-90, March 2006.
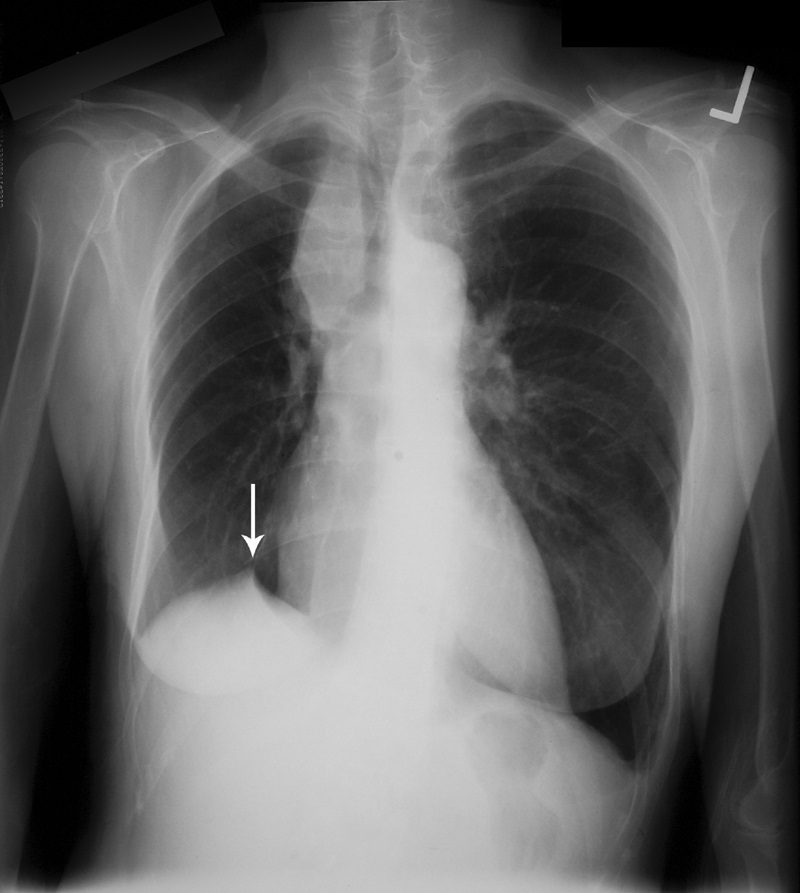
On frontal chest radiographs, this sign presents as a curvilinear density projecting over the right retrocardiac region, signifying left atrial enlargement (Fig. 9).32 The curvilinear line represents the inferolateral margin of the left atrium.33 The double density sign may be observed in patients without cardiac disease; however, there is a semiquantitative measurement to estimate the left atrial diameter and better estimate whether it is a real finding.33 Higgins et al found that, on PA radiographs of adult patients, if the left atrial dimension is defined as the distance from the midpoint of the double density to the inferior wall of the left mainstem bronchus, a distance greater than 7 cm was consistent with a diagnosis of left atrial enlargement, confirmed on echocardiography.33 The measurement was found to be an unreliable sign in the evaluation of pediatric patients with a double density sign on PA radiographs.33
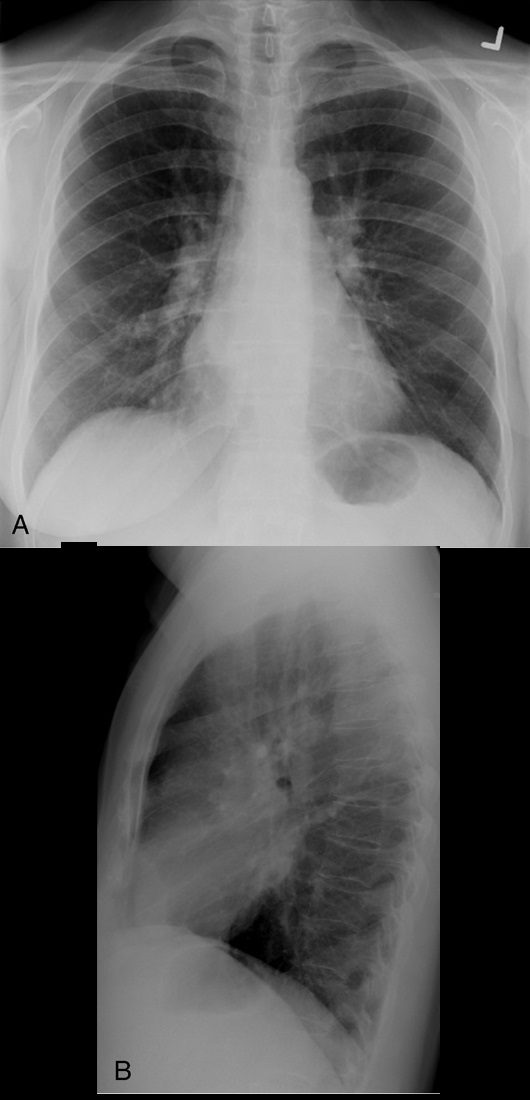
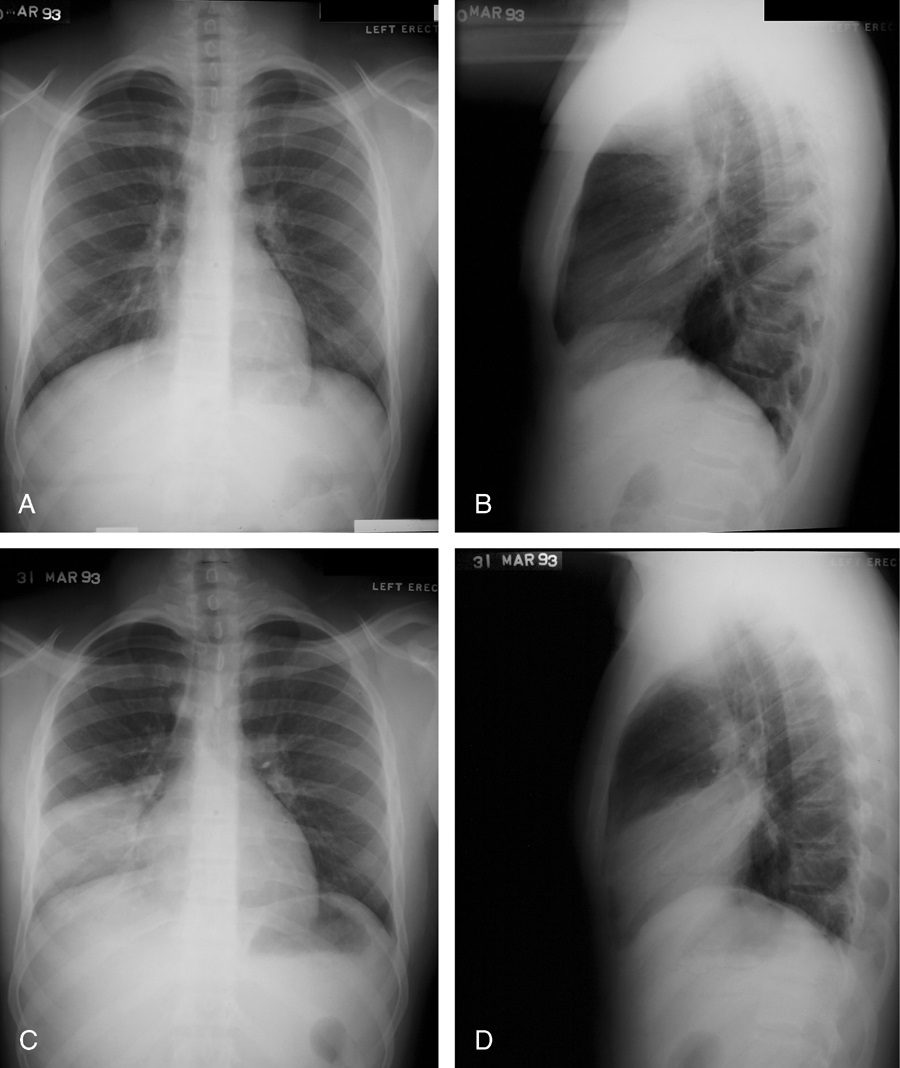
Doughnut sign
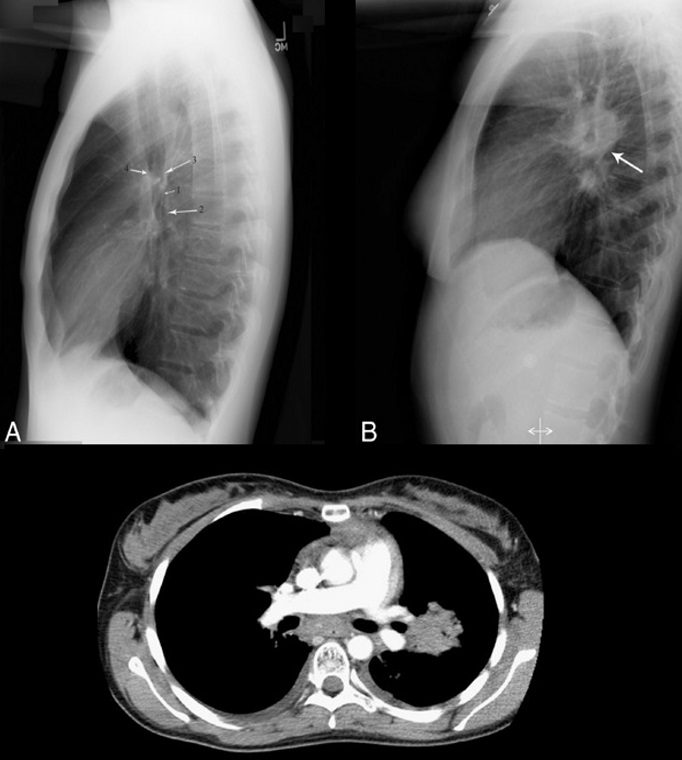
Source
Signs in Thoracic Imaging
Journal of Thoracic Imaging 21(1):76-90, March 2006.
Although CT is widely accepted as the primary modality for detecting mediastinal lymphadenopathy, chest radiography is generally the initial radiographic investigation performed. On a normal lateral chest radiograph (Fig. 10A), the aortic arch and right and left pulmonary arteries are visualized in an “inverted horseshoe” configuration.34 In the presence of subcarinal lymphadenopathy (Figs. 10B, C), the inferior portion of the “horseshoe” fills in.34 The lymphadenopathy appears as a mass posterior to the bronchus intermedius and inferior to the tracheal bifurcation, completing the rounded hilar “doughnut” density.34,35
Finger-in-glove sign
Source
Signs in Thoracic Imaging
Journal of Thoracic Imaging 21(1):76-90, March 2006.
Tubular shadows of soft tissue opacity akin to gloved fingers are seen on thoracic radiographs (Figs. 11A, B) and CT (Fig. 11C) and typically originate in the upper lobes in a bronchial distribution.2–4,36,37 The tubular, fingerlike projections represent dilated, mucoid-impacted bronchi surrounded by aerated lung. When an inciting stenosis or bronchial obstruction occurs, mucous glands will continue to produce fluid, while the secretions are continually taken to the site of narrowing by mucociliary transport.38 As the secretions become inspissated, debris accumulates distal to the point of obstruction, and bronchiectasis ensues. Visualization of the gloved fingers is made possible by collateral air drift through the interalveolar pores of Kohn and canals of Lambert aerating lung distal to the point of mucoid impaction. There are 2 broad etiologic categories: non-obstructive and obstructive.38 Non-obstructive causes, such as allergic bronchopulmonary aspergillosis (ABPA), asthma, or cystic fibrosis, are common considerations. ABPA is seen most commonly in asthmatic patients and occurs after inhaled Aspergillus organisms are trapped in airway mucus, triggering subsequent type I and type III allergic reactions.38 The acute type I response results in bronchoconstriction, heightened vascular permeability, wall edema, and protracted mucus production, whereas the delayed type III response causes immunopathological damage to the involved bronchi.38 Mucoid impaction in the setting of cystic fibrosis is secondary to mucociliary dysfunction and thick mucous secretions. Benign (bronchial hamartomas or lipomas) and malignant (bronchogenic carcinoma or carcinoid tumors) neoplasms are considerations in the obstructive category. Congenital obstructive causes, such as bronchial atresia, intralobar sequestration, or bronchogenic cysts, might also be considered.
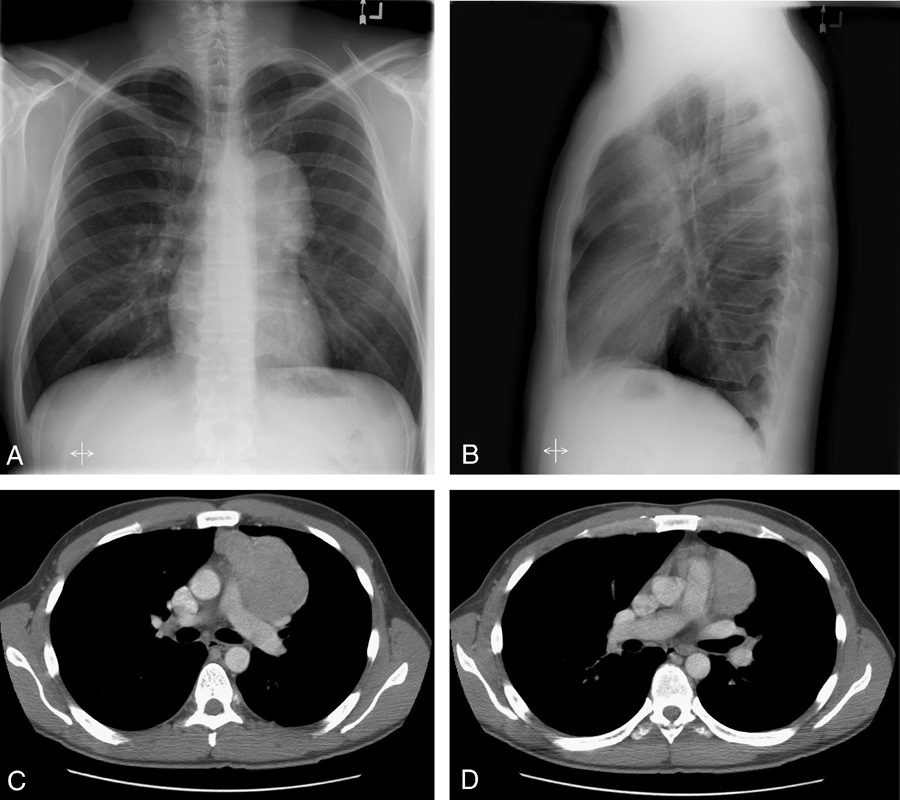
Fleischner sign
Source
Signs in Thoracic Imaging
Journal of Thoracic Imaging21(1):76-90, March 2006.
Felix Fleischner was a German-born radiologist who immigrated to the United States during the second World War.39 The finding that bears his name refers to enlargement of the proximal pulmonary arteries on plain chest radiography (Fig. 12A) or angiography (Fig. 12B) secondary to pulmonary embolism.40,41 This occurs most commonly in the setting of massive pulmonary embolism (defined angiographically as involving 50% or more of the major pulmonary artery branches)42 and has a relatively low sensitivity in diagnosis.43 The enlargement can be caused by massive embolus enlarging the luminal diameter of the proximal artery in the acute setting but can also be seen in the subacute to chronic setting due to elevated pressures in the pulmonary arterial circulation.44 An important ancillary finding is the abrupt tapering of the occluded pulmonary artery distally, creating the “knuckle sign.”44
Golden S sign aka S Sign of Golden
Source
Signs in Thoracic Imaging
Journal of Thoracic Imaging 21(1):76-90, March 2006.
Dr Ross Golden was an American-born radiologist who originally described this sign as a form of right upper lobe collapse associated with a central mass.45 When the right upper lobe bronchus is obstructed by an endobronchial lesion, there is elevation and medial displacement of the minor fissure with proximal convexity of the fissure due to the mass (Fig. 13). This creates the “reverse S” characteristic of central obstructing bronchogenic carcinomas.3,4,45 Given the same presentation of a proximal, obstructing endobronchial lesion within the left upper lobe bronchus with associated left upper lobe collapse, the upwardly retracted major fissure will follow an S-shaped contour along its length. Although initially used to describe signs of right upper lobe collapse, the Golden S sign can be applicable to atelectasis involving any lobe.46
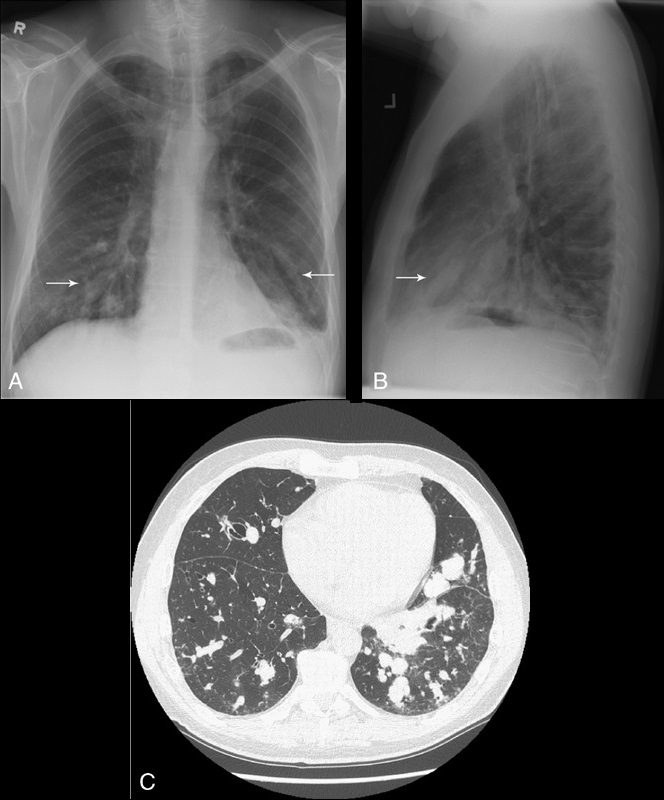
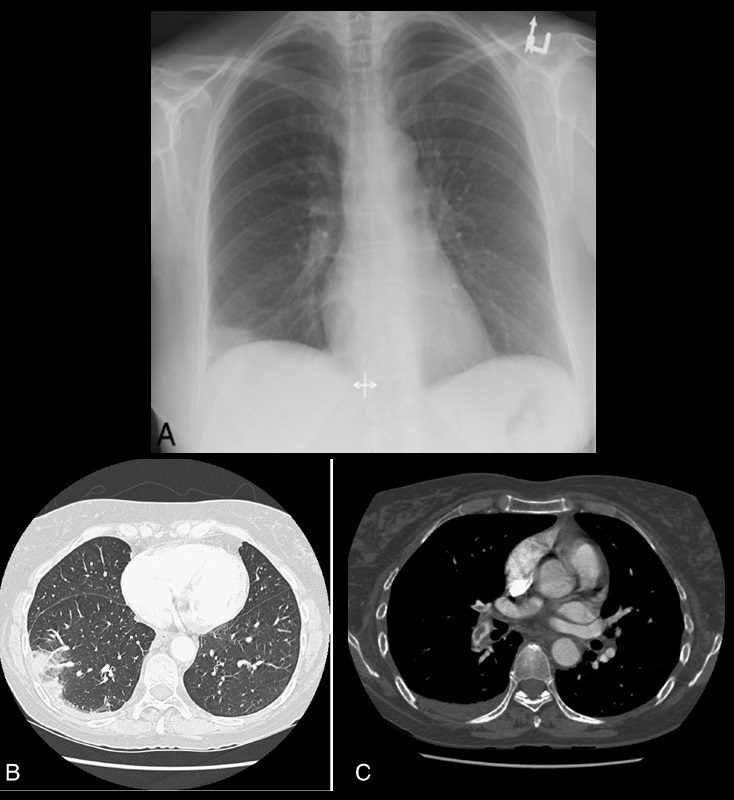
Hampton hump
Source
Signs in Thoracic Imaging
Journal of Thoracic Imaging 21(1):76-90, March 2006.
On plain radiographs (Fig. 14A) and CT (Figs. 14B, C), pulmonary infarcts are typically multifocal, peripheral in location, contiguous with one or more pleural surfaces, and more commonly confined to the lower lungs.3,47,48 The apex of these rounded or triangularly shaped opacities may point toward the hilum.3 The opacities resolve slowly over a period of several months, akin to “melting ice cubes,” and may leave a residual scar.3 The first documentation of the finding was made by Aubrey Otis Hampton, who was a practicing radiologist in the mid 1920s. He and his co-author Castleman first reported evidence of incomplete pulmonary infarction in the setting of PE in the 1940s.47,48 Autopsy follow-up showed evidence of intra-alveolar hemorrhage without alveolar wall necrosis in the first 2 days of infarction. After 2 days, wall necrosis begins and eventually leads to pulmonary infarction and an organized scar.47,48 Hampton also observed that there were differences in the healing of these incomplete infarcts depending on their premorbid cardiac history.47,48 In patients without heart disease, the incomplete infarcts would generally heal without scarring, whereas patients with congestive failure were more likely to progress to infarction with a persisting pulmonary scar.47,48 When pulmonary embolism results in infarction, airspace opacities typically develop within 12 to 24 hours.3,48
Hilum overlay sign
Source
Signs in Thoracic Imaging
Journal of Thoracic Imaging 21(1):76-90, March 2006.
In evaluating densities projecting over the hila on PA chest radiographs, it is important to evaluate whether the opacity blends with the normal hilar shadow of the proximal pulmonary arteries and obscures clear visualization or if the mass and hilar structures are overlapping but distinct from one another. If the hilar vessels are sharply delineated, then it can be assumed that the overlying mass is anterior (Fig. 15) or posterior to the centrally located vascular structures and the intervening aerated lung enables crisp visualization of the pulmonary vessels.12,13 However, when the mass is inseparable from the proximal pulmonary arteries, it is assumed that the structures are immediately adjacent to one another, with the lack of interposing air obscuring the margins of the normal hilar structures. This sign was originally described by Benjamin Felson.12,13
Juxtaphrenic peak sign
Source
Signs in Thoracic Imaging
Journal of Thoracic Imaging 21(1):76-90, March 2006.
This sign, first documented by Kattan et al in 1980,49 is an ancillary sign of upper lobe collapse, depicted as a triangular opacity projecting superiorly over the medial half of the diaphragm, at or near its highest point (Fig. 16). It is most commonly related to the presence of an inferior accessory fissure.49,50 Although the mechanism is not certain, one theory suggests it is due to the negative pressure of upper lobe atelectasis causing upward retraction of the visceral pleura and extrapleural fat protruding into the recess of the fissure.49 A recent retrospective analysis of patients who have undergone upper lobectomies suggests that the prevalence of the sign increases in the ensuing weeks after intervention and documents its utility in specifically recognizing the type of surgery.51
Luftsichel sign
Source
Signs in Thoracic Imaging
Journal of Thoracic Imaging 21(1):76-90, March 2006.
The word Luftsichel is German for “air crescent.” The finding is seen in the setting of left upper lobe collapse. Due to the absence of a minor fissure on the left, as the left upper lobe collapses, the major fissure assumes a vertical position roughly parallel to the anterior chest wall.4 As volume loss progresses, the fissure continues to migrate more anteriorly and medially until the atelectatic lobe is contiguous with the left heart border, effectively obliterating its contour on the frontal radiograph (Figs. 17A–C). With movement of the apical upper lobe segment anteromedially, the superior segment of the left lower lobe hyperinflates and fills the vacated apical space.4,52 Occasionally this segment will insinuate itself between the aortic arch and the collapsed left upper lobe creating a sharp outline, or periaortic lucency, described as the Luftsichel.3,4,52
Scimitar sign
Source
Signs in Thoracic Imaging
Journal of Thoracic Imaging 21(1):76-90, March 2006.
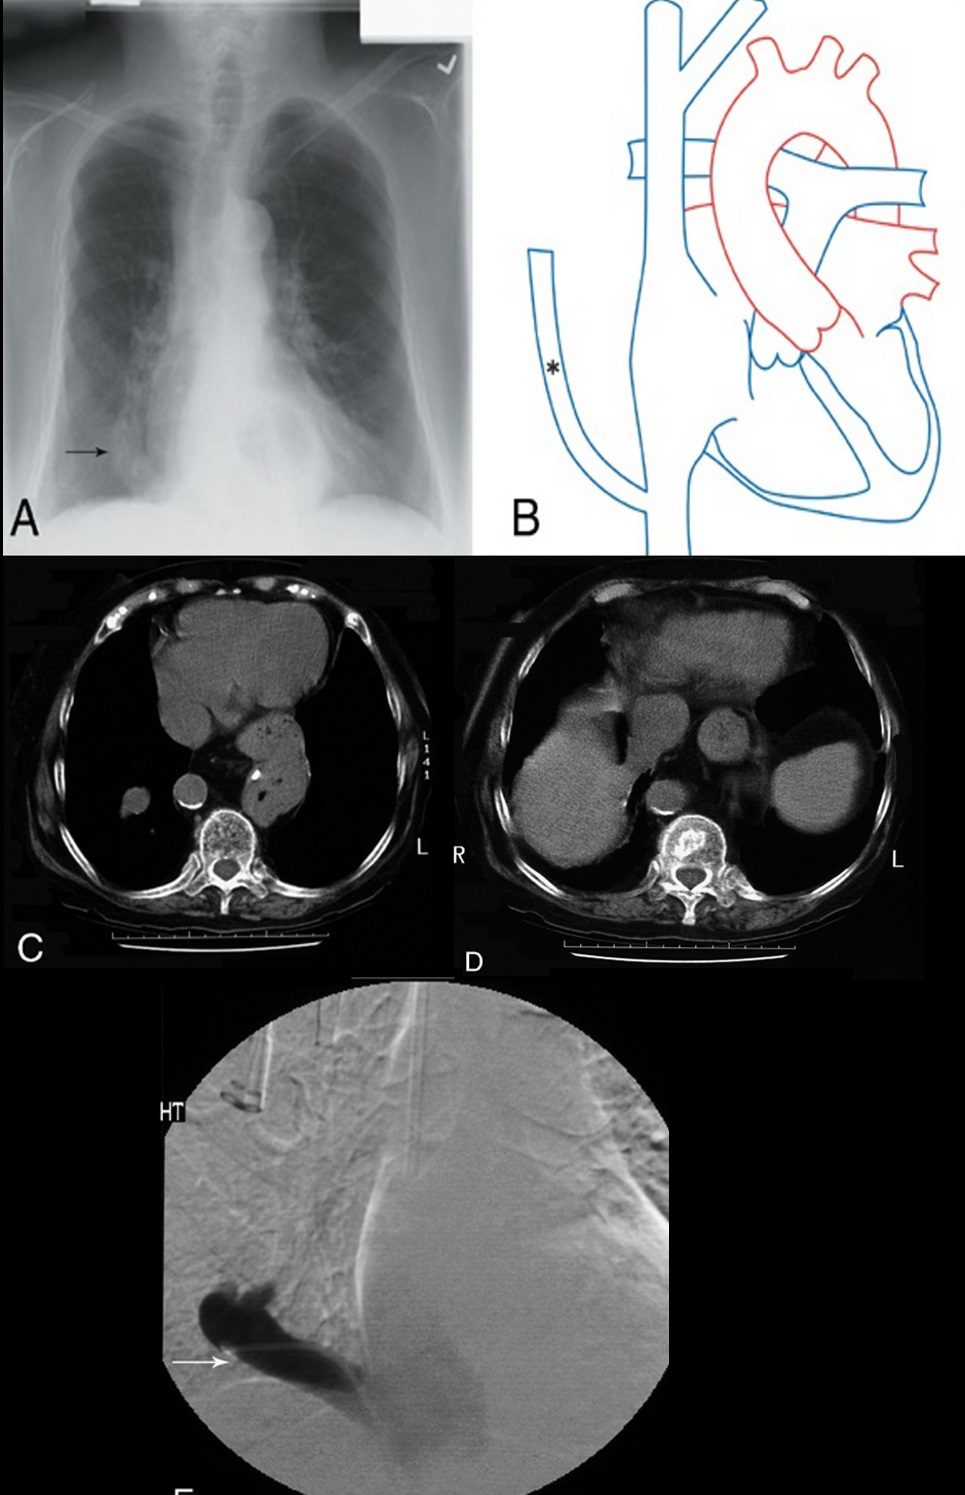
On PA chest radiography, a characteristic broad, curved shadow extends inferiorly toward the diaphragm along the right side of the heart (Figs. 18A, B).53 Its appearance resembles a Turkish sword and signifies a partial anomalous pulmonary venous return, most commonly to the infradiaphragmatic inferior vena cava (Figs. 18C–E). It is part of the congenital hypogenetic lung (scimitar) syndrome.4,53
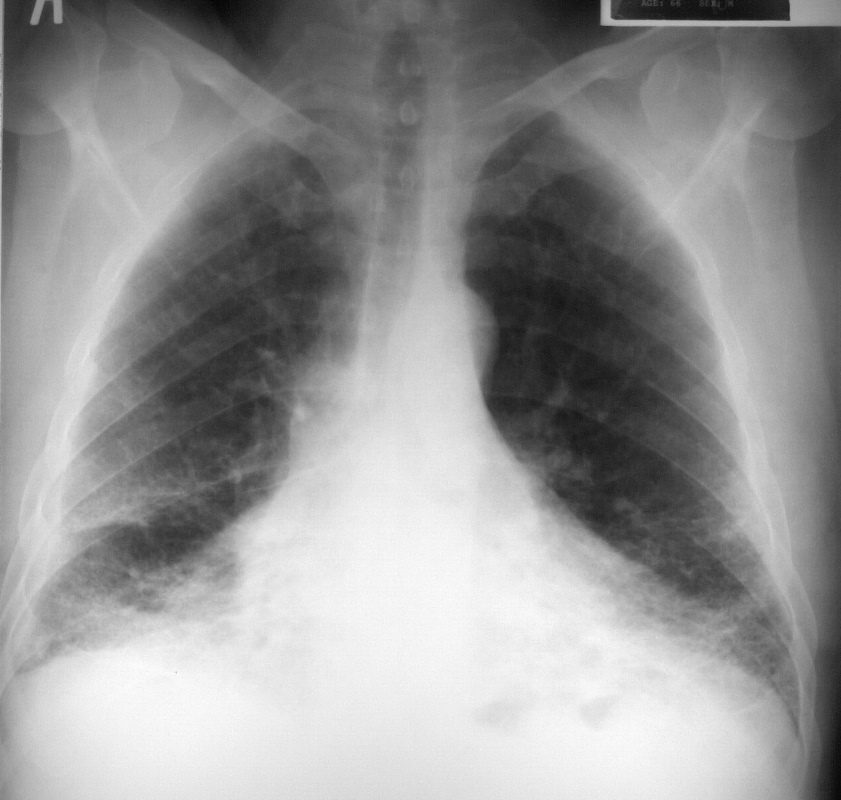
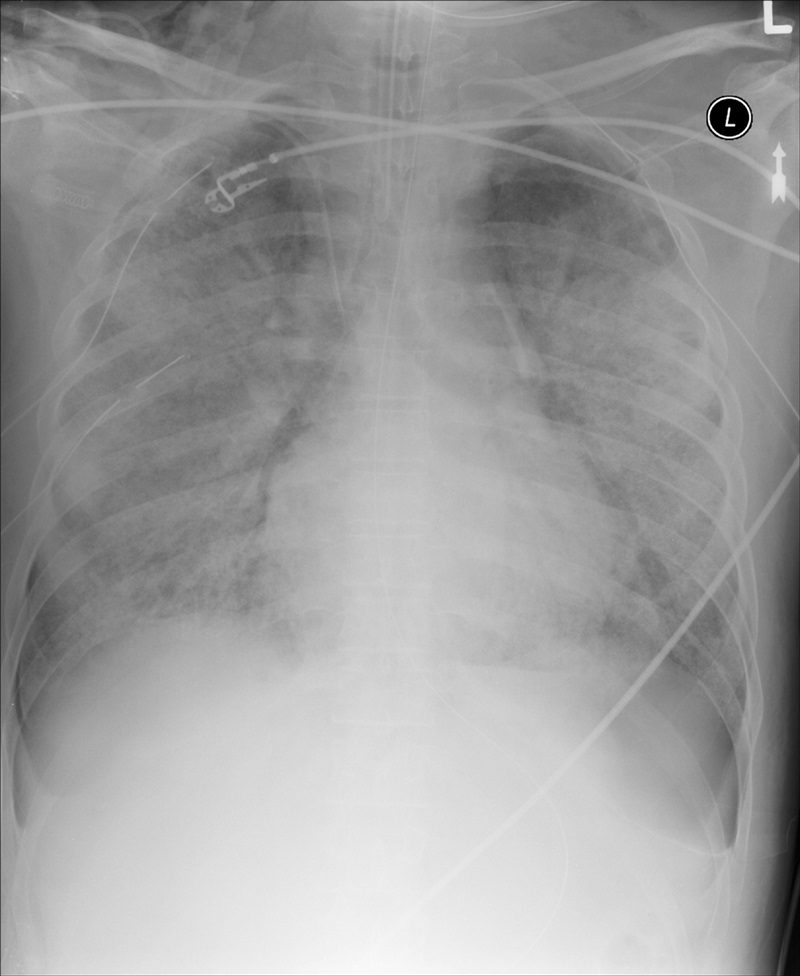
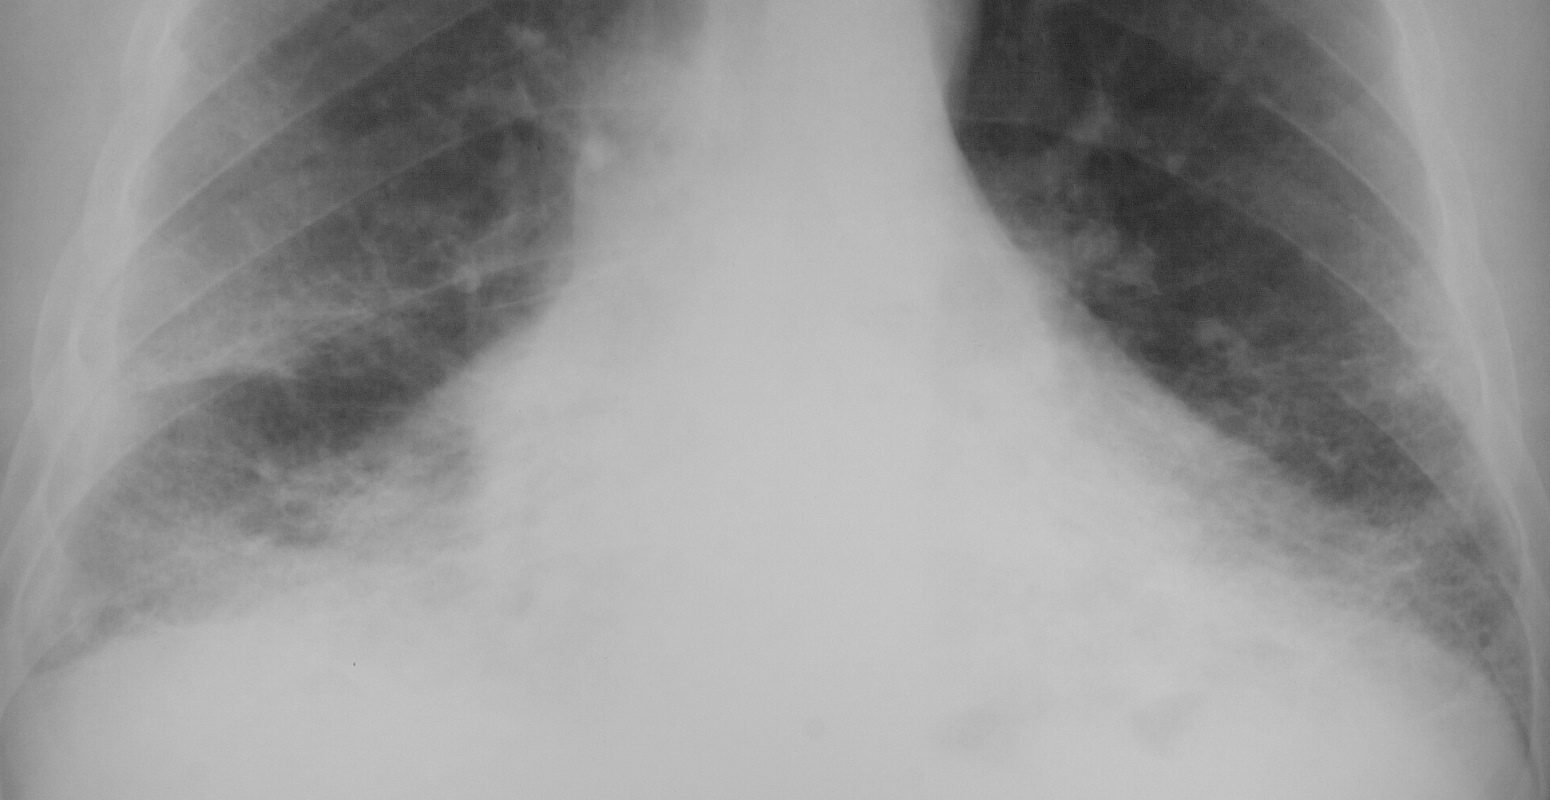
This is a frontal chestX-ray of a 66year old man who swept asbestos fibers off the floor for many years. The image characterises the “shaggy heart border” due to the interstitial process in the middle lobe and lingula.
Courtesy Ashley Davidoff MD 2019
Courtesy Ashley DAvidoff MD 2019
32615.8
Courtesy Ashley Davidoff MD 2019
32617.8
Signet ring sign
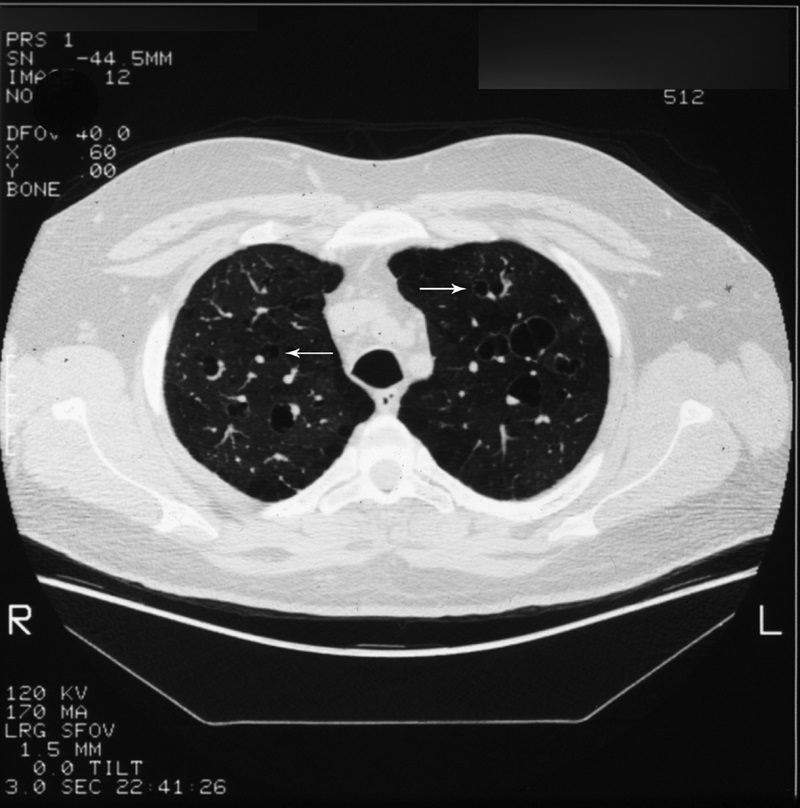
Source
Signs in Thoracic Imaging
Journal of Thoracic Imaging 21(1):76-90, March 2006.
Described on chest CT (Fig. 19, arrows) as a circle of soft-tissue attenuation abutting a lucent ring, this sign depicts the pulmonary artery lying adjacent to a dilated bronchus in cross-section.54–57 The sign is found on CT in patients with bronchiectasis, or irreversible, abnormal bronchial dilatation.56 Accompanying findings, such as peribronchial thickening, lack of bronchial tapering, and visualization of bronchi within 1 cm of the pleura, are all contributing findings confirming the diagnosis. In isolation, an enlarged bronchoarterial ratio may be a spurious finding, as bronchial diameter varies with parameters such as altitude.58 Measurement of the bronchial luminal diameter is made between the inner walls so as not to overestimate in cases with associated peribronchial thickening. Bronchiectasis occurs due to bronchial wall injury, most often due to necrotizing viral or bacterial bronchitis.4,57,58 It can also occur secondary to bronchial obstruction with subsequent mucus production dilating the involved airways, as mentioned previously with the finger-in-glove sign. Finally, in the setting of pulmonary fibrosis or radiation-induced lung injury, traction on the adjacent bronchi will cause dilatation. Other entities, such as cystic fibrosis and Kartagener syndrome, are also associated.4,57
Silhouette sign
Source
Signs in Thoracic Imaging
Journal of Thoracic Imaging 21(1):76-90, March 2006.
This classic roentgenographic sign first described by Felson in 1950 states that “an intrathoracic lesion touching a border of the heart, aorta, or diaphragm will obliterate that border on the roentgenogram. An intrathoracic lesion not anatomically contiguous with a border of one of these structures will not obliterate that border.”13,59,60 The underlying premise of the silhouette sign is that visualization of a roentgen shadow depends on a difference in radiographic density between adjacent tissues.13 For example, obscuration of the right heart border is often used to differentiate a right middle lobe process from a lower lobe abnormality (Fig. 20).3,4,60 Similarly, if the left heart border is partially or completely obliterated, the lingula is the region of involvement. Conversely, the absence of the silhouette sign can help in further localizing a lesion. With lower lobe disease, the right or left heart border on the side of involvement is preserved, whereas the silhouette of the hemidiaphragm is obliterated in cases of lower lobe collapse or consolidation (Fig. 21). The basic tenets of the silhouette sign are used to explain various other signs discussed previously, such as the cervicothoracic and hilum overlay sign.
Silhouette sign
Source
Signs in Thoracic Imaging
Journal of Thoracic Imaging 21(1):76-90, March 2006.
If the left heart border is partially or completely obliterated, the lingula is the region of involvement. Conversely, the absence of the silhouette sign can help in further localizing a lesion. With lower lobe disease, the right or left heart border on the side of involvement is preserved, whereas the silhouette of the hemidiaphragm is obliterated in cases of lower lobe collapse or consolidation (Fig. 21). The basic tenets of the silhouette sign are used to explain various other signs discussed previously, such as the cervicothoracic and hilum overlay sign.
Split pleura sign
Source
Signs in Thoracic Imaging
Journal of Thoracic Imaging 21(1):76-90, March 2006.
Separation and enhancement of the visceral and parietal pleural layers on CT (Fig. 22) is considered strong evidence of empyema.3,61 Normally, individual pleural layers are not discernable as discrete structures.3 Empyemic fluid fills the pleural space, resulting in thickening and enhancement of the pleura with a denotable separation.3,61
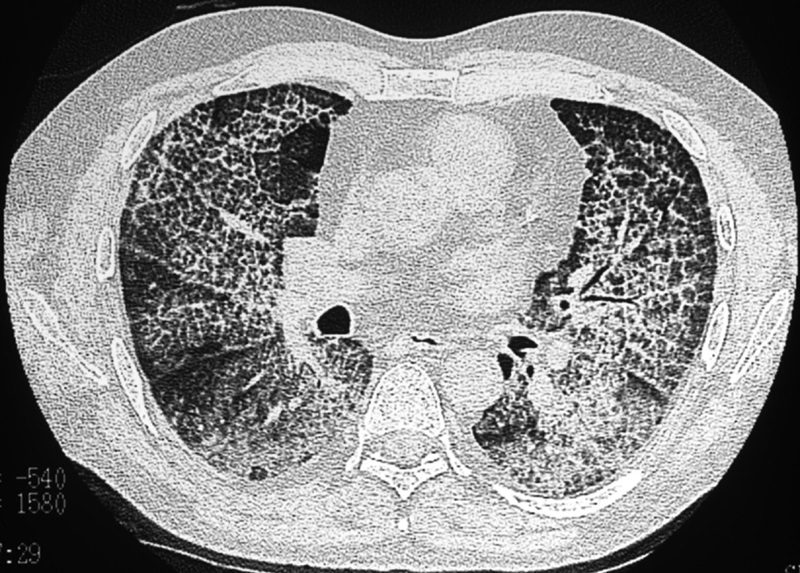
Tree-in-bud sign
Source
Signs in Thoracic Imaging
Journal of Thoracic Imaging 21(1):76-90, March 2006.
Best seen on high resolution computed tomography (HRCT) (Fig. 23), this sign appears as small, peripheral, centrilobular soft tissue nodules connected to multiple contiguous, linear branching opacities.3,4,62,63 This radiologic term represents the mucous plugging, bronchial dilatation, and wall thickening of bronchiolitis.3,4,62,63 The histopathological correlate demonstrates small airway plugging with mucus, pus, or fluid, with dilated bronchioles, peribronchiolar inflammation, and wall thickening. Anatomically, this sign relates to viscous fluid blocking the intralobular bronchiole of the secondary pulmonary lobule.63 Ordinarily the intralobular bronchiole is not visualized at HRCT (<1 cm); however, when filled with fluid and inflamed, the bronchiole becomes visible at the resolution of thin-slice CT.63 Although commonly associated with infectious etiologies such as endobronchial spread of Mycobacterium tuberculosis, recent evidence suggests that the sign is not specific for any one pulmonary disease, but includes other infectious entities such as Pneumocystis jiroveci (Pneumocystis carinii) pneumonia and invasive pulmonary aspergillosis. In addition, various immunodeficiency states, congenital disorders (cystic fibrosis), malignancy (lymphoma), panbronchiolitis,62 and aspiration are other etiologies in which tree-in-bud may be seen and, thus, clinical correlation is important in elucidating a diagnosis.3,4,62,63
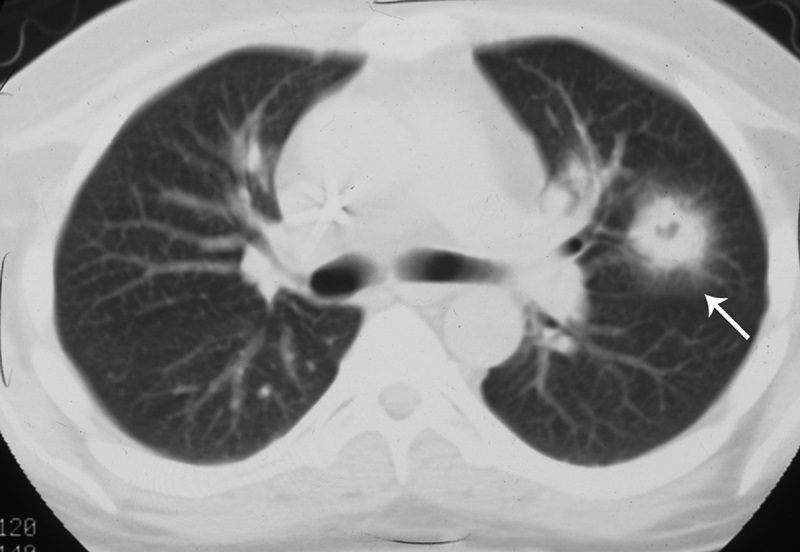
Westermark sign
Source
Signs in Thoracic Imaging
Journal of Thoracic Imaging 21(1):76-90, March 2006.
Neil Westermark was a 20th-century German radiologist who first discovered that a certain subset of patients diagnosed with pulmonary embolism (PE) were complicated by pulmonary infarction.64 He described the “anemic” or oligemic peripheral regions of lung parenchyma as “wedge-shaped shadows.” Interestingly, he also found that the majority of patients with PE did not have pulmonary infarcts, a finding that has been affirmed in the more recent literature.47 The chest radiograph (Fig. 24A) and CT (Fig. 24B) findings of increased translucency (chest radiograph) or hypoattenuation (CT) corresponding to oligemia in the periphery of the lung distal to an occlusive arterial embolus is typical.3,4,64 Visualization typically signifies either occlusion of a larger lobar or segmental artery or widespread small vessel occlusion.4,64